


Tianjin Updates
2025-12-12
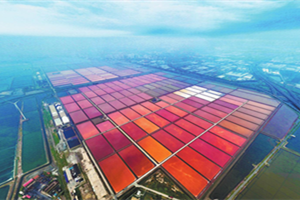
Salt of the earth
In the vast, sun-drenched coastal expanse of Tianjin's Binhai New Area in early autumn, the landscape shimmers. Here, where the waters of the Bohai Sea meet the land, lies the Tianjin Changlu Hangu Salt Field, a place that has been continuously harvesting salt for over a millennium.
read more- Hands-on with Tianjin tech vibes
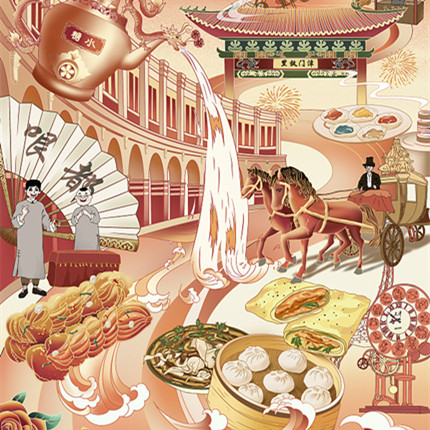
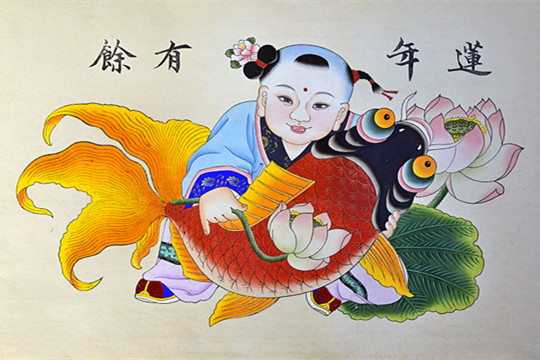
- Foreign guests encounter Tianjin's iconic folk art
- Set up regional hubs to foster innovation-led growth

 Why Tianjin
 Investment Guide
 Industry
 Industrial Parks
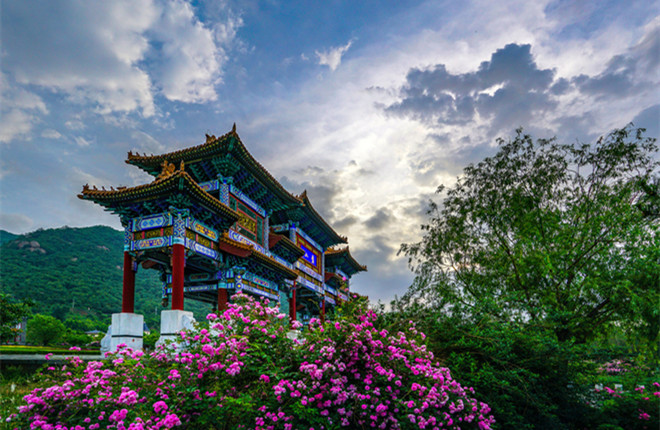


 Health
 Visas
Visas Education
 Sports and recreation
 Adoption
 Marriage
Arts & Culture
- Traditional Arts
- Venues
- Architecture


Copyright ©? Tianjin Municipal Government.
All rights reserved. Presented by China Daily.
京ICP備13028878號-35